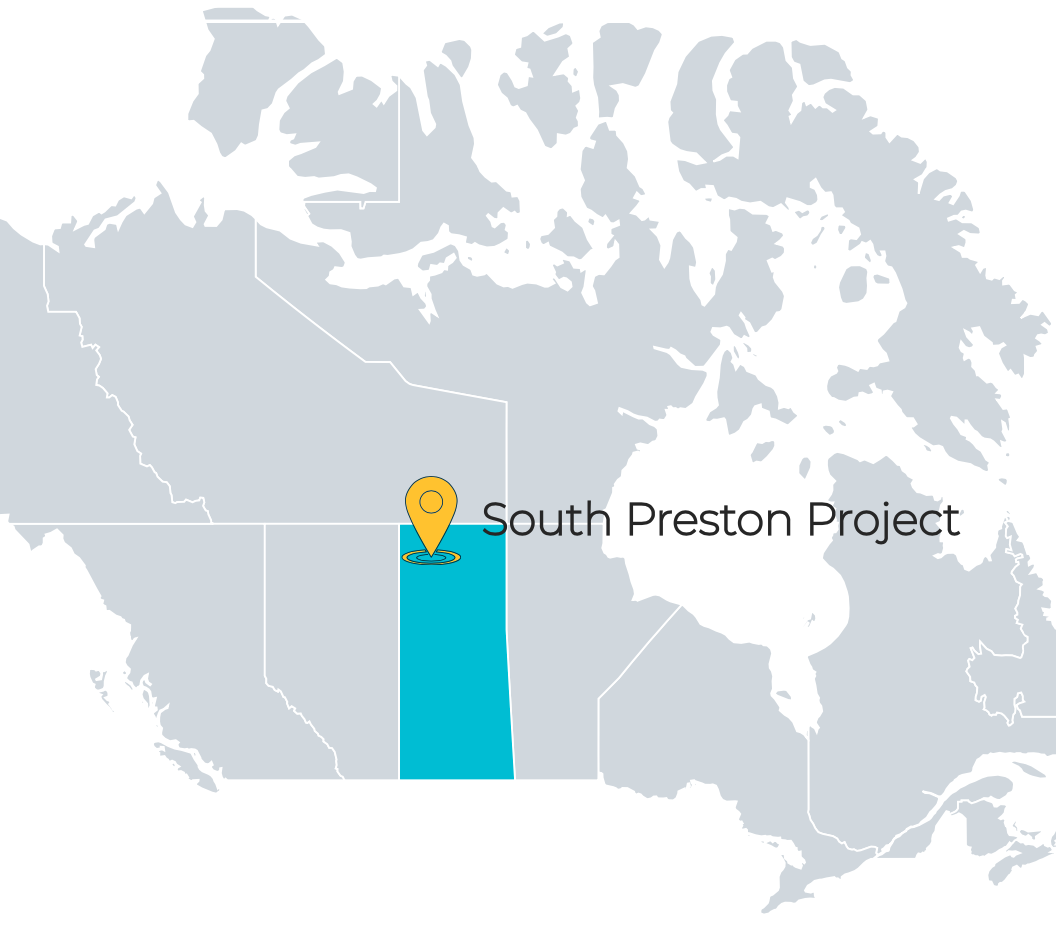
CAT Strategic’s district-scale South Preston Uranium Property is located in the southwest area of Canada’s Athabasca Basin and spanning across 29,395 hectares.Athabasca Basin is known as the one of the world’s leading sources of high-grade uranium, supplying ~20% of the world’s uranium.

Recently there has been a several discoveries within the same area that South Preston Project is located:
South Preston project has more than 10km of adjacent property border with NexGen Energy Ltd., more than 18.5 km of continuous project boundary with Orano (a leading global uranium producer), and 50 km of contiguous claim border with Azincourt Energy Corp.
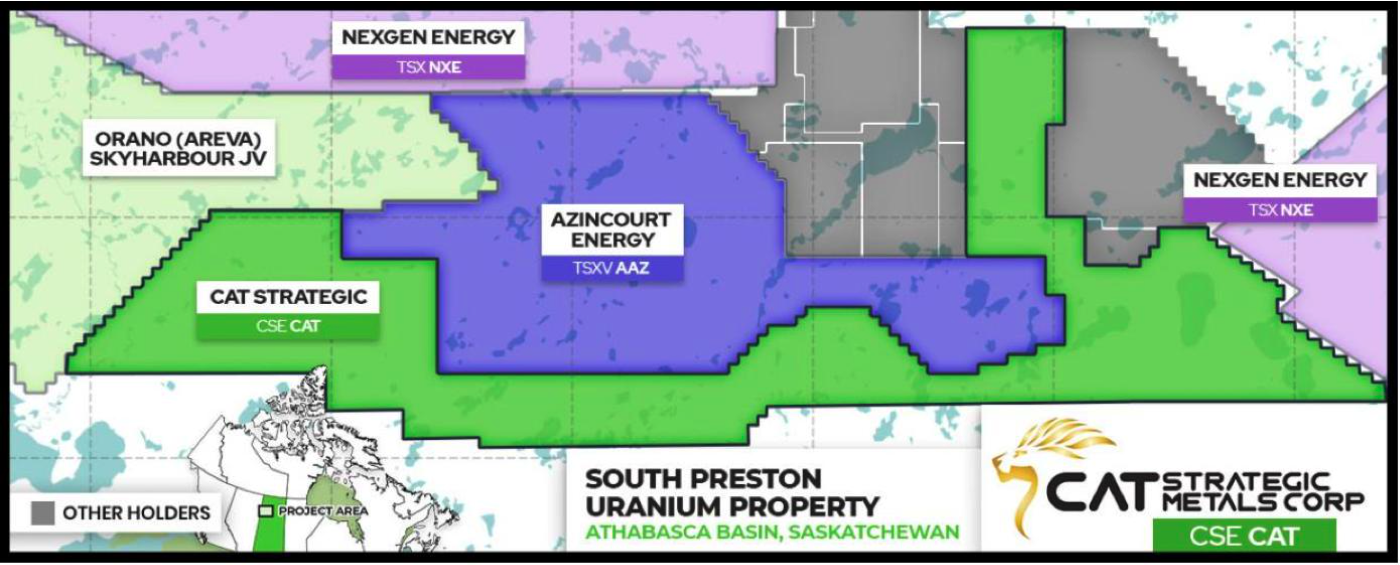
The property could potentially be hosting the extension of a priority uranium exploration corridor extending from NexGen Energy Ltd.’s Rook-1 Project through Azincourt Energy Corp.’s adjacent East Preston Uranium Project and onto CAT’s South Preston Uranium Property.
Although very little exploration has been carried out on the property, historical and recent exploration in the surrounding area have outlined features that are summarized in Figure 2. Airborne geophysical surveying identified areas of high background radioactivity in western areas of the property and NE-striking conductors were located to the north and trending towards the CAT property. On-going exploration by Azincourt Energy Corp. (“Azincour or AAZ”) has identified conductive corridors which have recently been drilled and have been shown to contain sheared, graphitic basement rocks that are commonly the host for uranium deposits elsewhere in the Athabasca Basin.
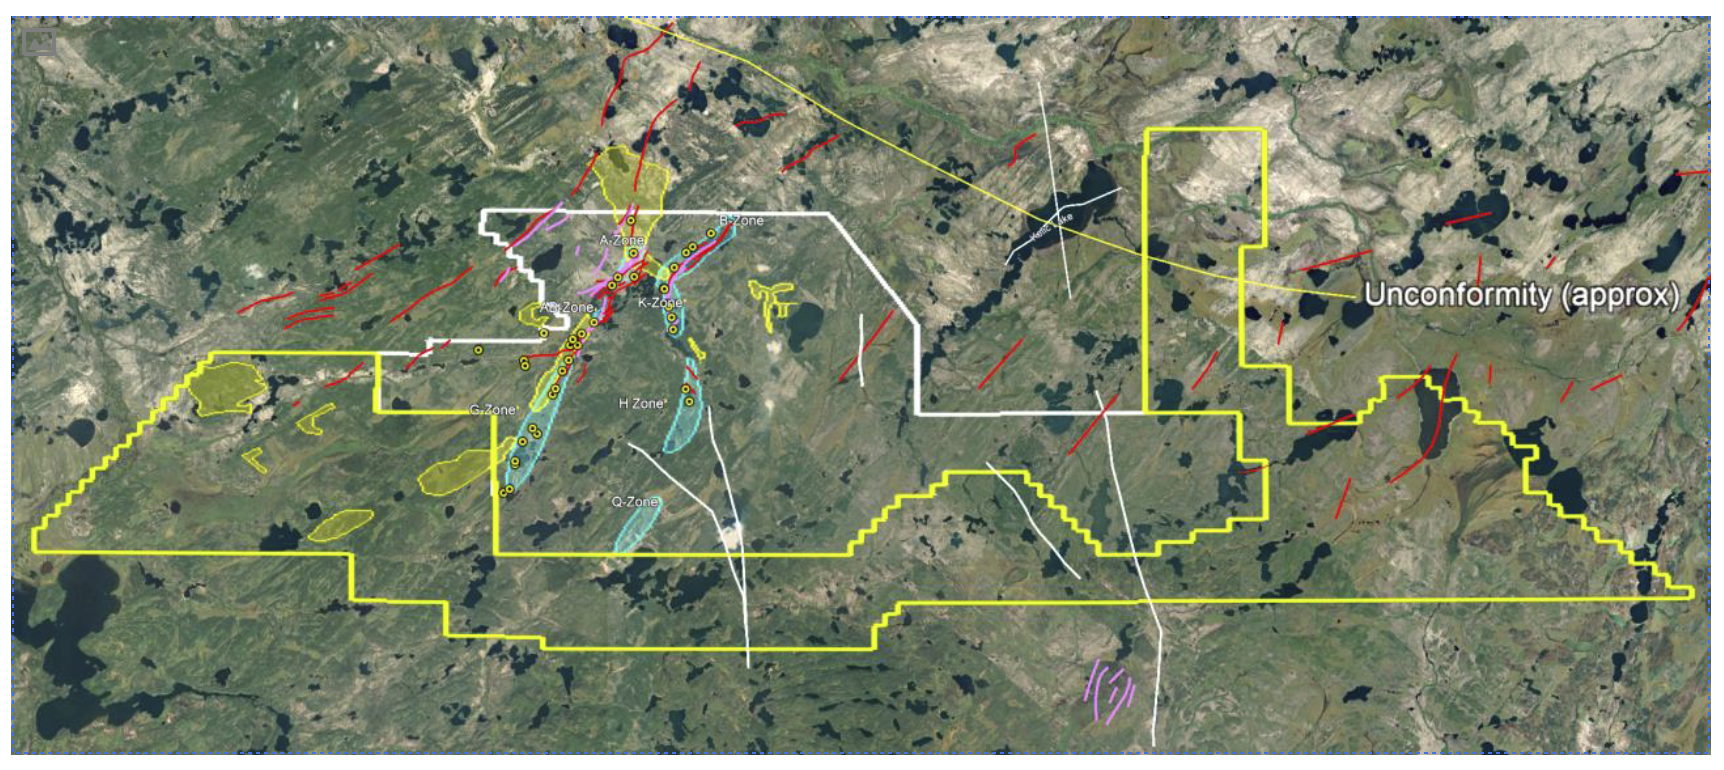
The CAT property is outlined in yellow. The light blue areas left of centre are conductive corridors currently being explored by Azincourt with its drill holes shown as yellow dots. The light blue band located right of centre is a zone of graphitic metasedimentary rocks. Areas of elevated radioactivity from historical surveys are shown as yellow-filled polygons outlined by white. Red lines shown the location of EM conductors identified previously in the general area. White traces, generally trending N-S or NW-SE, are lineaments interpreted to represent major fault zones. The approximate location of the Athabasca unconformity is indicated by the yellow line arcing across the top of the image from centre towards the right (east). The area of view is approximately 60 kilometres west to east with Lloyd Lake located at lower left.
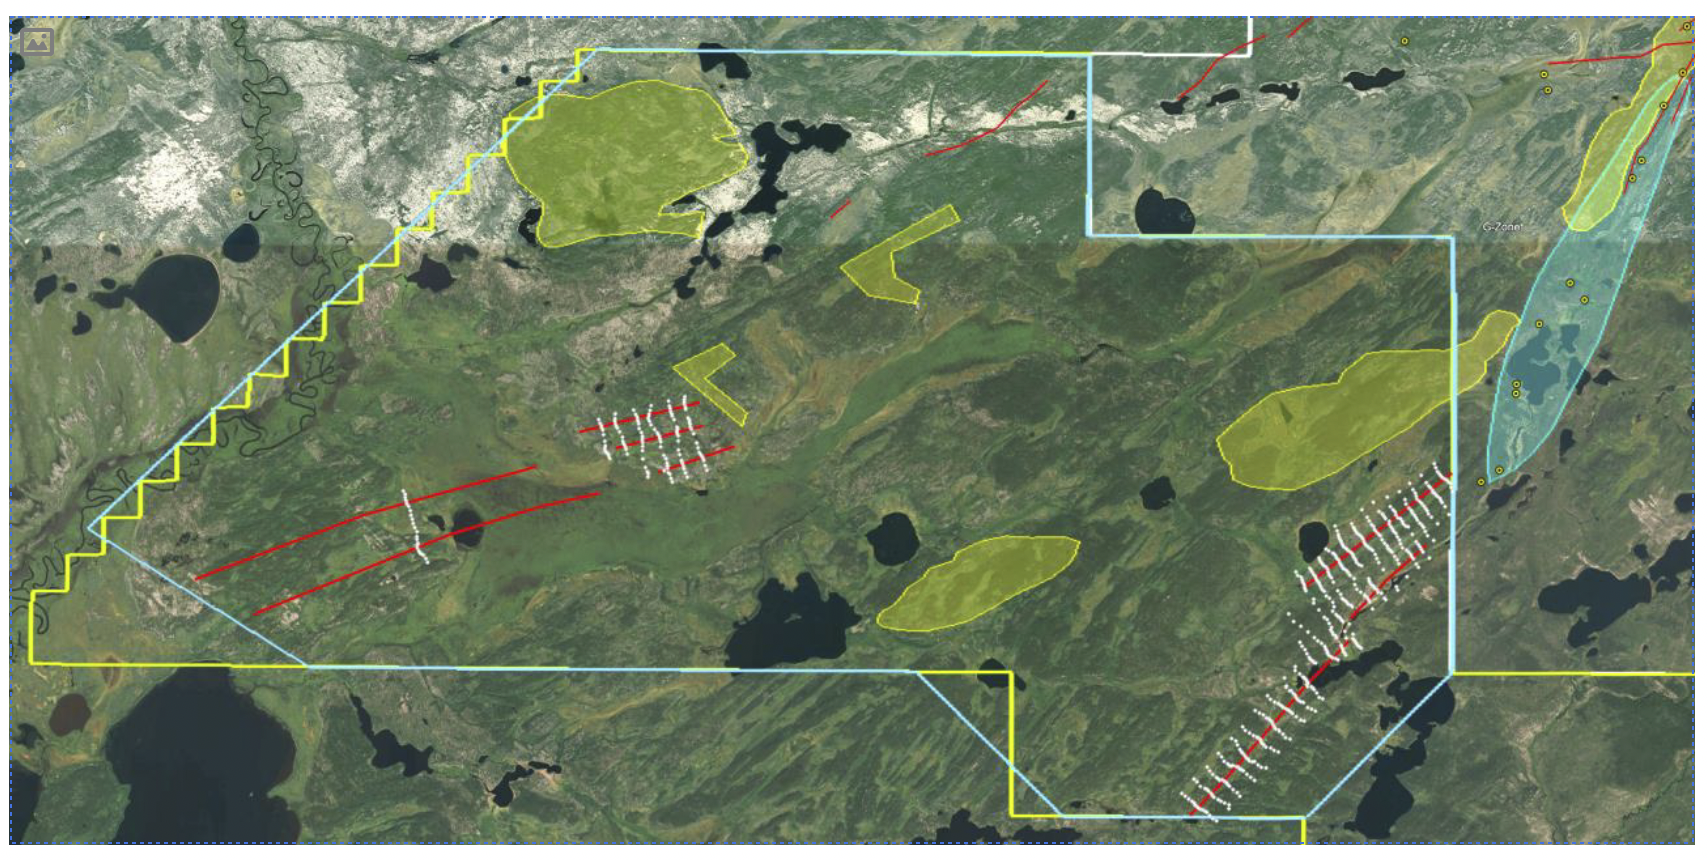
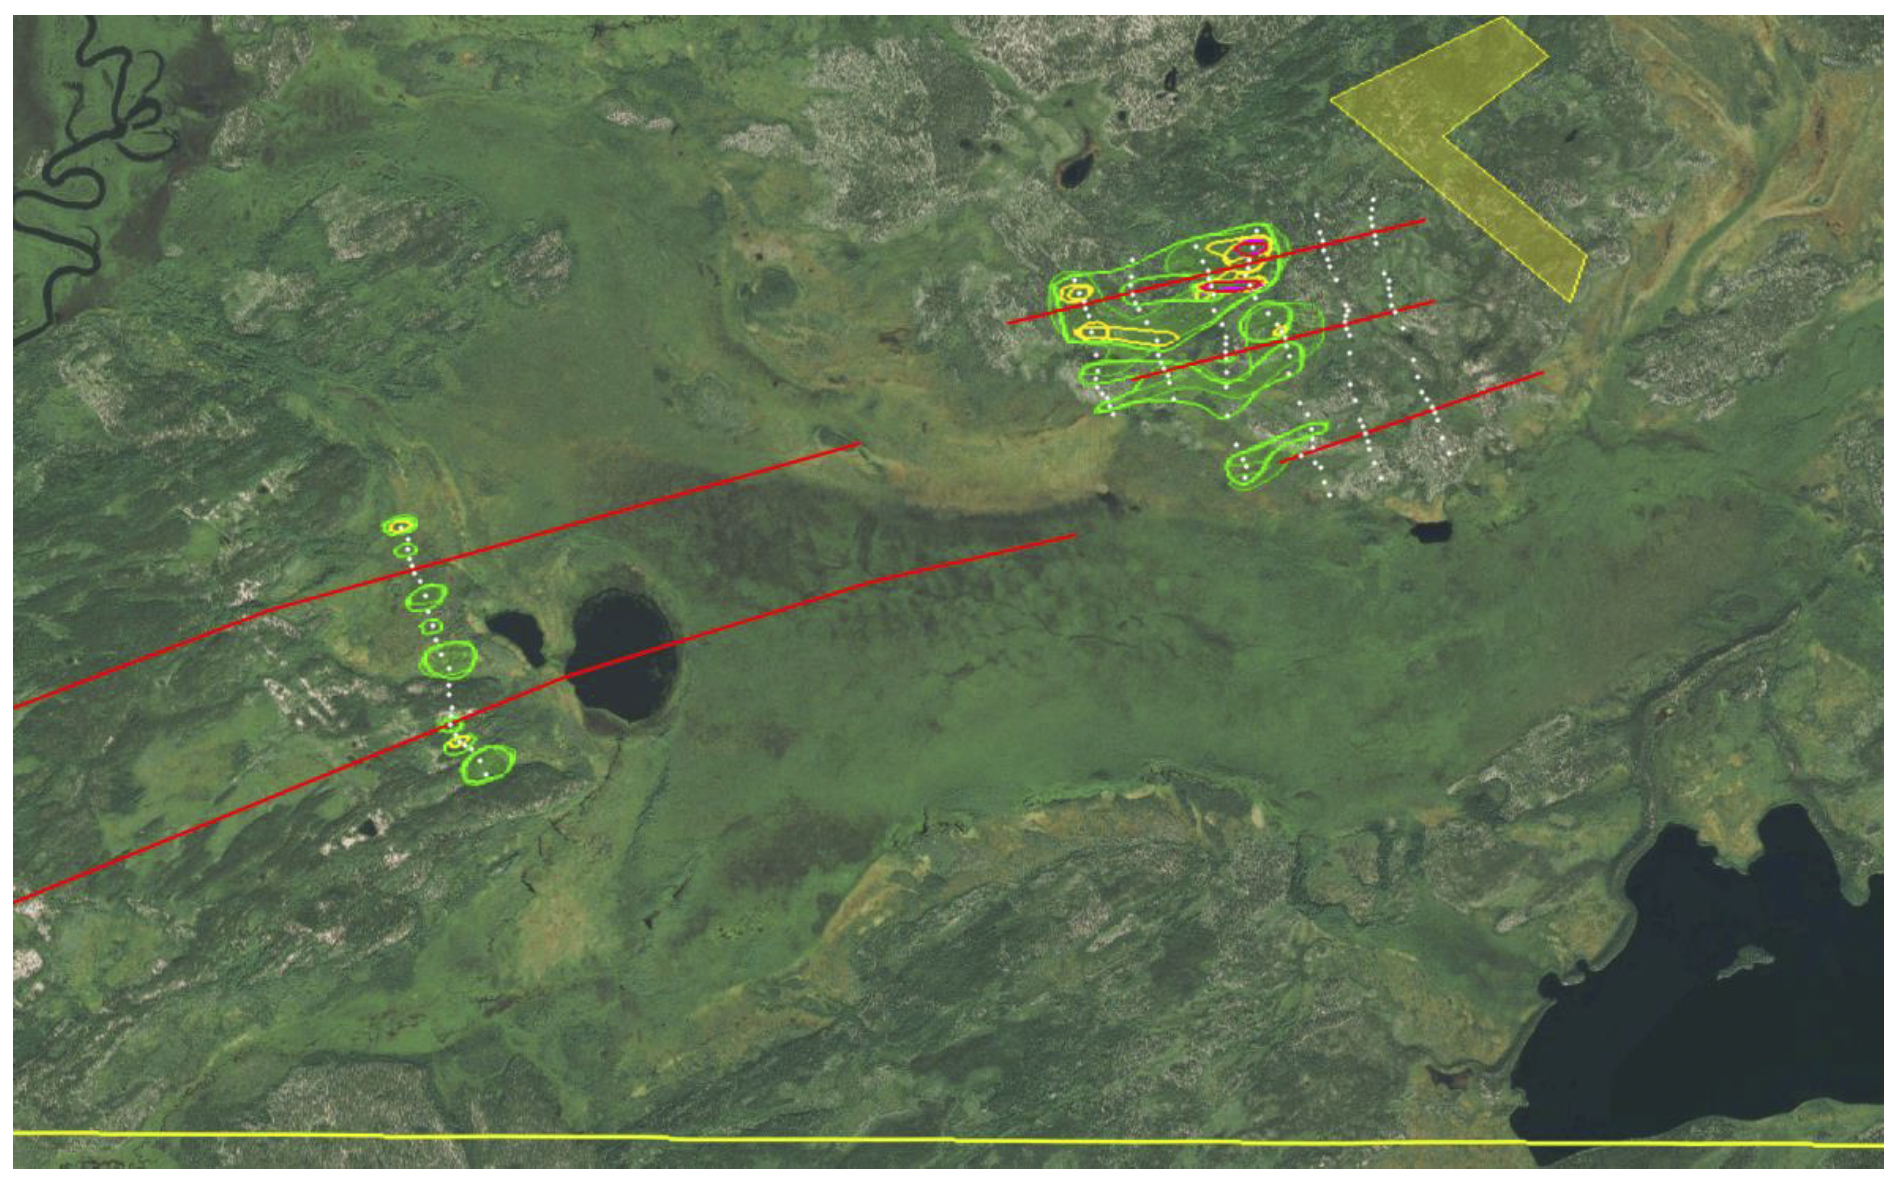
The CAT property is outlined in green and the western block of mag-EM surveying is outlined in blue. The light blue area at upper right is the conductive corridor currently being explored by Azincourt with its drill holes shown as yellow dots. Yellow-filled polygons outlined by white are areas of elevated radioactivity from historical surveys. Heavy red lines shown the location of EM conductors discovered by CAT. White dots on profiles across the conductors show the location of CAT’s biogeochemical samples. The field of view is 18 km west to east.
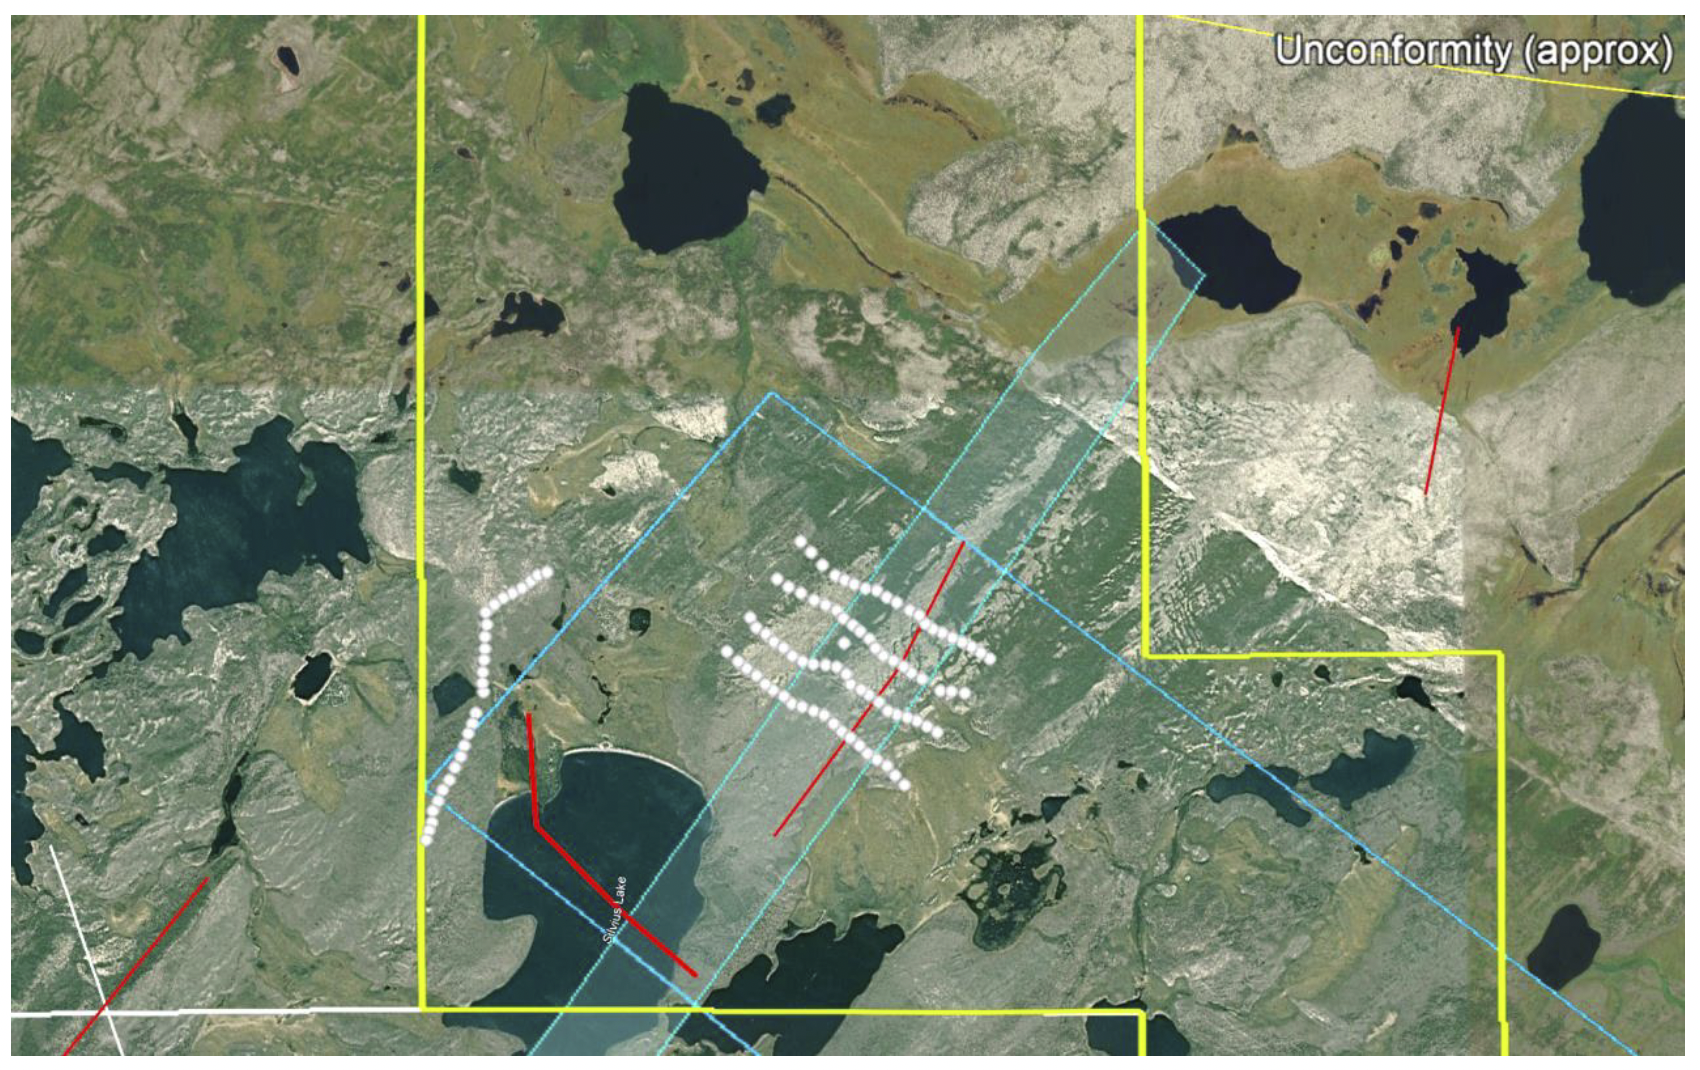
The CAT property is outlined in green. The eastern block surveyed by EM-mag is partially outlined in blue. Thin red lines show historical EM conductors generated by various means. The pale blue NNE-trending band indicates the location of frost heaved graphitic metasedimentary and pegmatitic boulders. The heavy red line at upper left crossing Silvius Lake is an EM conductor detected during the CAT survey. CAT’s biogeochemical samples are shown as white dots. The field of view is approx. 7 km. west to east.
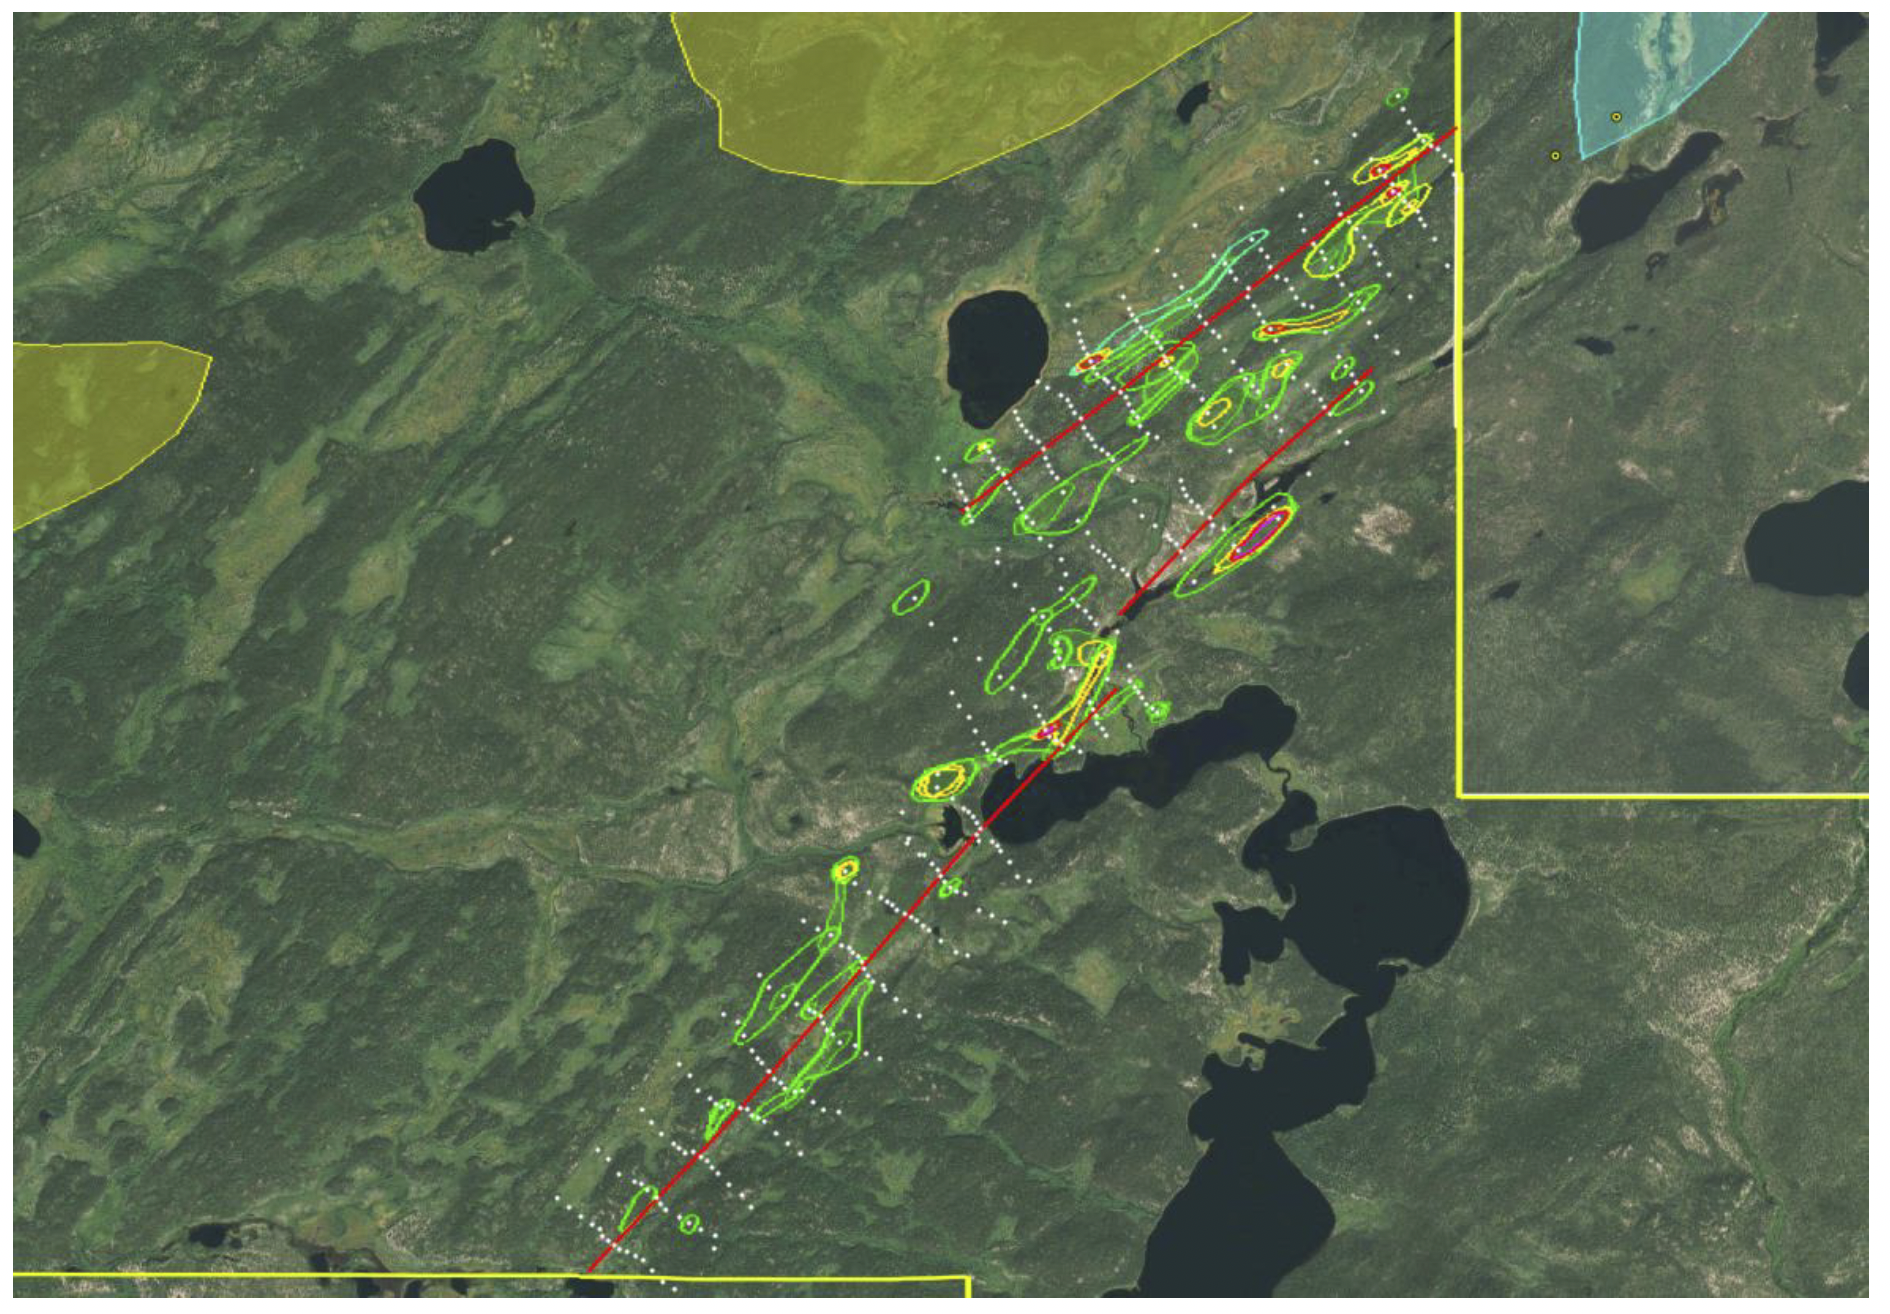
Uranium bio-geochemical anomalies in the western survey area. The green line surrounds values exceeding the m (5.97 ppm); orange surrounds values above m+1 s.d. (19.3 ppm) and red surrounds sites exceeding m+2s.d. (32.6 ppm). The highest uranium value was 118 ppm. Red NE-trending linear features are conductors discovered from CAT’s July 2022 airborne survey. The CAT property boundary is indicated by yellow lines. Yellow shaded polygons are areas of elevated background radioactivity from historical data. The Azincourt ‘G-Zone’ conductive corridor is indicated by the blue shaded area at upper right. North is up. The field of view is approx. 7 km east to west. The conductive features shown on the CAT property have a strike length of approximately 4,800 metres.
Uranium bio-geochemical anomalies in the western reconnaissance survey area. The green line surrounds values exceeding the m (5.97 ppm); orange surrounds values above m+1 s.d. (19.3 ppm) and red surrounds sites exceeding m+2s.d. (32.6 ppm). The highest uranium value was 81.6 ppm. Red ENE-trending linear features are conductors discovered from CAT’s July 2022 airborne survey. The southern boundary of the CAT property is indicated by the yellow line. Yellow shaded polygons are areas of elevated background radioactivity from historical data. North is up. The field of view is approx. 6 km east to west. The conductive features shown on the CAT property have a strike length of approximately 5,400 metres.
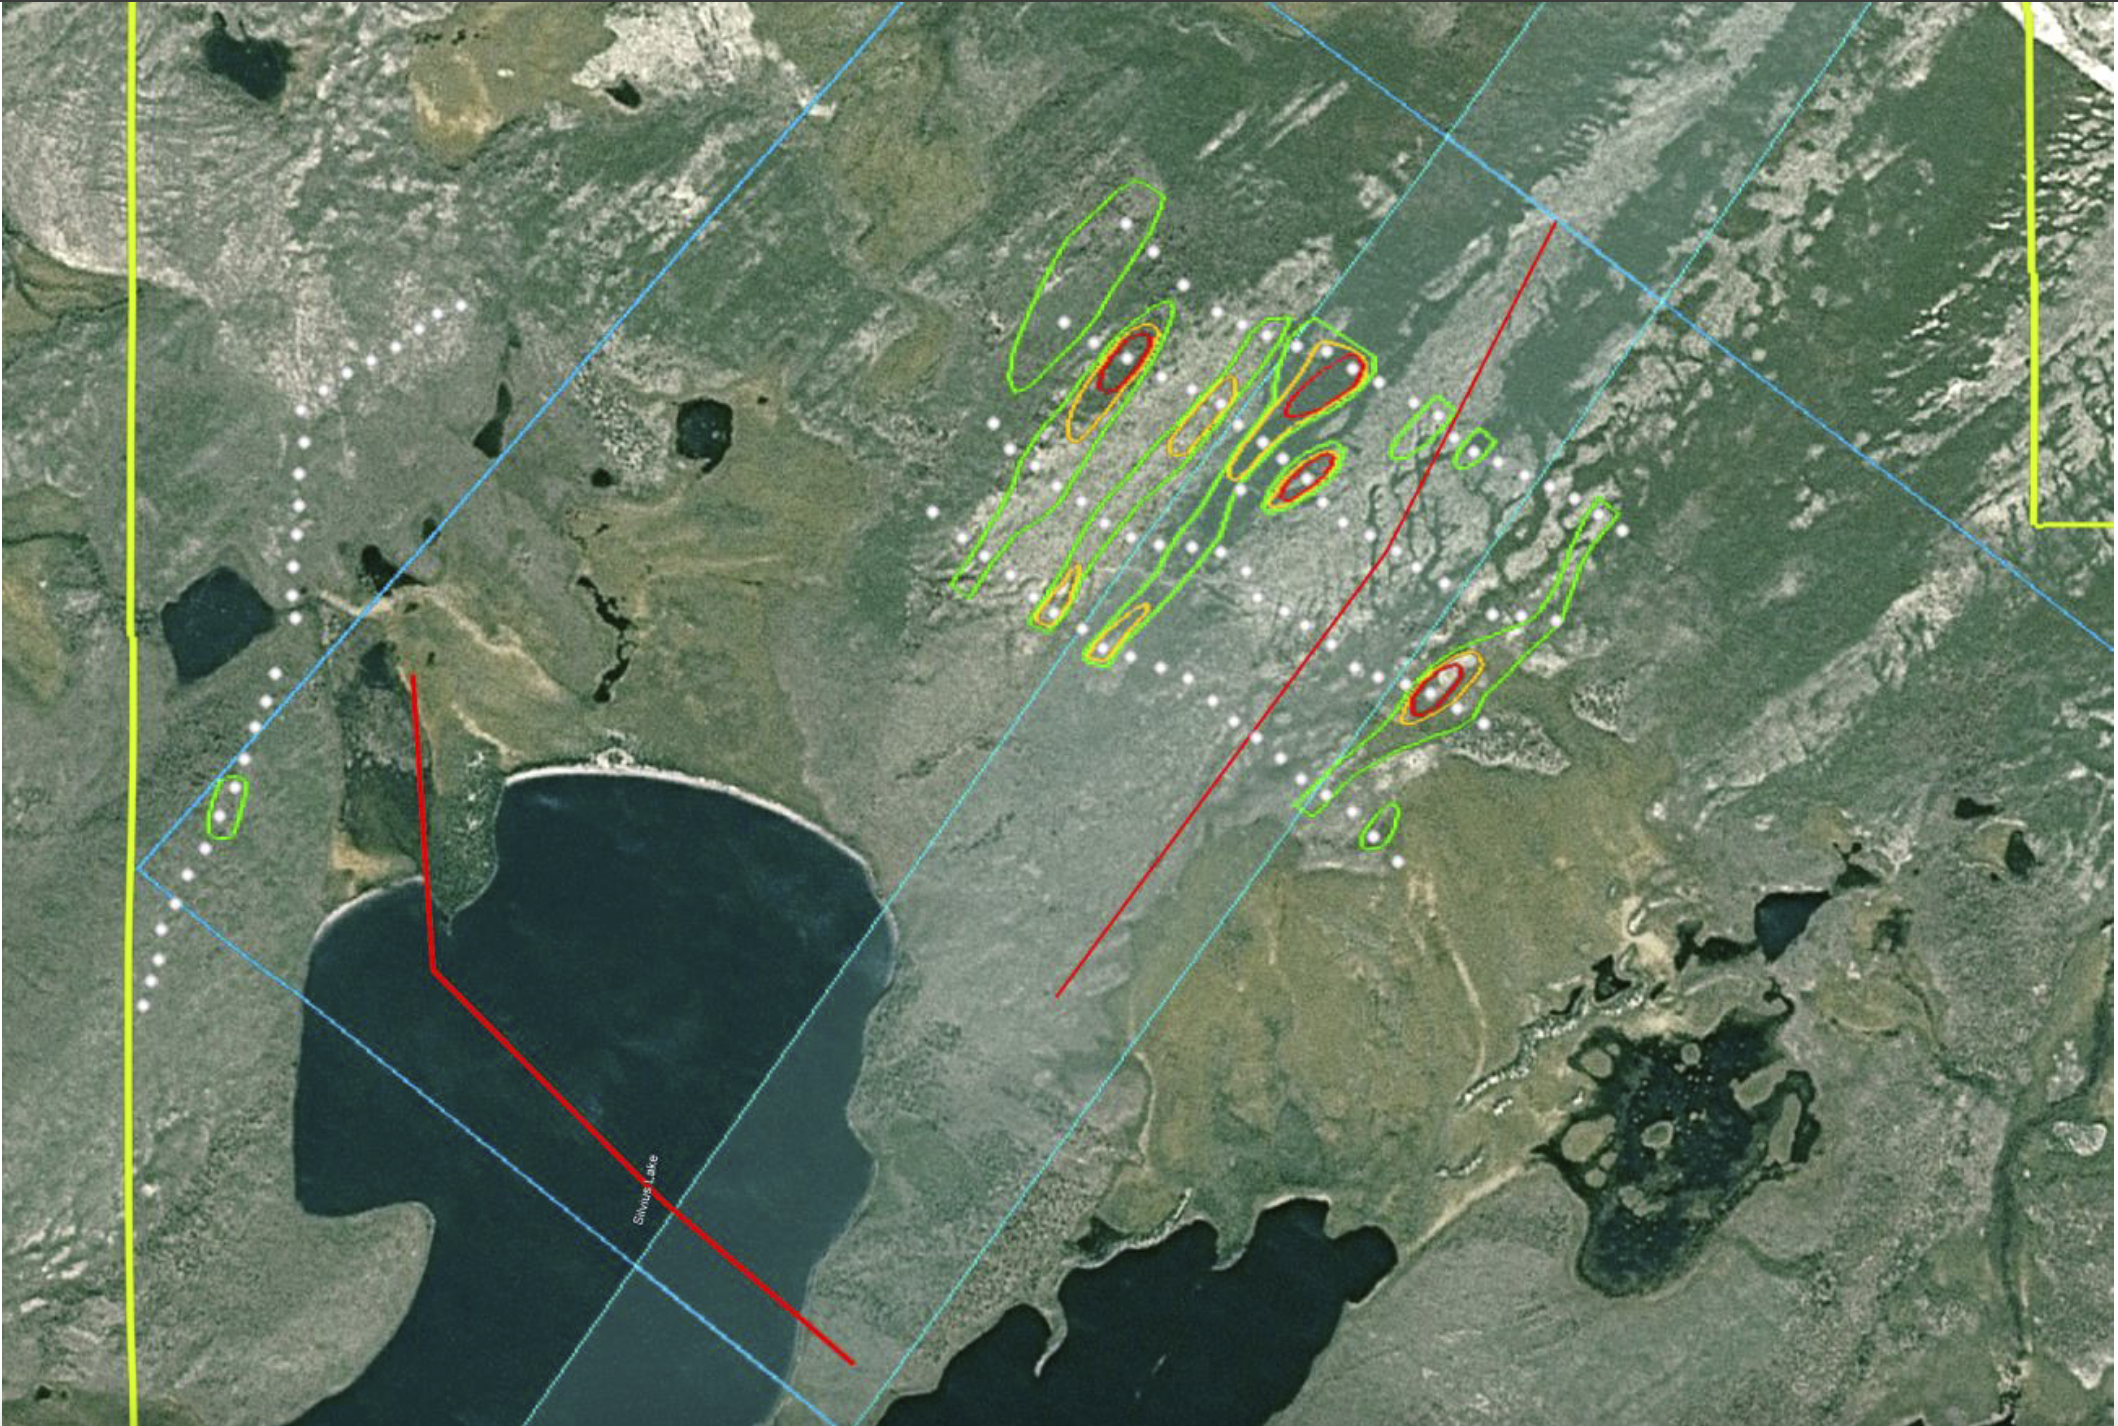
Uranium bio-geochemical anomalies in the eastern survey area. The green line surrounds values exceeding the m (18.1 ppm); orange surrounds values above m+1 s.d. (45.8 ppm) and red surrounds sites exceeding m+2s.d. (73.4 ppm). The highest uranium value was 186 ppm. A NW-trending conductor, partially under Silvius Lake, was detected from CAT’s July 2022 airborne survey. Another historical conductor is shown as a red NE-trending line. The CAT property boundary is indicated by yellow lines. The pale blue corridor is a zone containing sheared and graphitic rocks in bedrock and in boulders. North is up. The field of view is approximately 3,500 m east to west. The NE-trending anomalies shown are 900 km in length but clearly extend NE and SW beyond the area sampled. The NE-trending lineaments in the terrain are though to reflect shearing in the underlying bedrock.